Curves and Paths
Curves from lerps
This chapter adds Bézier curves, Catmull-Rom curves and length tables. The curves lab draws four strips and moves a dot along each one.
A curve is a function from t to a point. A line uses one lerp. A
quadratic uses lerps between three control points. A cubic uses lerps between four
control points until one point remains.
t is not distance. On this cubic, t = 0.5 covers only
39.1 per cent of the curve's length. A dot that must move evenly needs a table of
lengths.
Sampling a curve
The page's cubic has control points P0 = (0, 0), P1 = (0, 32), P2 = (160, 32) and P3 = (240, 0): a hump that starts straight down, sweeps right, and leans to the right on its way back up. At t = 0.5, lerp each neighbouring pair: half way from P0 to P1 is (0, 16), from P1 to P2 is (80, 32), from P2 to P3 is (200, 16). Three points; lerp the neighbouring pairs again: (40, 24) and (140, 24). Two points; lerp once more: (90, 24). That is the curve at t = 0.5, and the same six lerps at any t give the point there. A quadratic is the same with three points and three lerps; a line is one lerp.
Written out, the six lerps multiply to weights on the four points: (1 − t)³, 3(1 − t)²t, 3(1 − t)t² and t³, which at t = 0.5 are 1/8, 3/8, 3/8 and 1/8. An eighth of (0, 0) plus three eighths of (0, 32) plus three eighths of (160, 32) plus an eighth of (240, 0) is (60 + 30, 12 + 12) = (90, 24), the same point by a different route; the recipe is the formula and the pinned tests check the two agree at eleven values of t. The weights say what the control points do: the curve starts at P0 and ends at P3, since the outer weights are 1 at the ends, and it never passes through P1 or P2, which only pull it.
A path laid down by hand wants a curve that passes through its points, and Catmull–Rom is the cubic that does: through P1 at t = 0 and P2 at t = 1, arriving along half of P2 − P0 and leaving along half of P3 − P1, so that a chain of them through a list of points joins smoothly at each one. A curve is drawn as a polyline, the straight pieces between samples at evenly spaced t, and thirty-two pieces are enough that the eye reads a curve. The same pieces measure it: the running sum of their lengths is a table, and reading the table backward, the t at which a given length has been covered, is what moves a dot evenly. For the page's cubic the thirty-two pieces total 250.7279 pixels, and a thousand and twenty-four total 250.7743, so the coarse table is short by less than a twentieth of one per cent; the sixteen pieces before t = 0.5 total 98.0398, 0.3910 of the whole.
// internal/vec/curve.go — create
package vec

// Lerp on points: the point the fraction t of the way from a to b.
func (a Vec2) Lerp(b Vec2, t float64) Vec2 {
	return a.Add(b.Sub(a).Scale(t))
}

// Quadratic is the Bézier curve of three control points at t, by de
// Casteljau: lerp neighbouring points until one is left. Two lerps make
// two points, and one more lerp between them is the answer.
func Quadratic(p0, p1, p2 Vec2, t float64) Vec2 {
	return p0.Lerp(p1, t).Lerp(p1.Lerp(p2, t), t)
}

// Cubic is the Bézier curve of four control points at t, by de Casteljau:
// three lerps make three points, two more make two, one more is the
// answer.
func Cubic(p0, p1, p2, p3 Vec2, t float64) Vec2 {
	a, b, c := p0.Lerp(p1, t), p1.Lerp(p2, t), p2.Lerp(p3, t)
	return a.Lerp(b, t).Lerp(b.Lerp(c, t), t)
}

// CubicClosed is the same curve written out: the four points weighted by
// (1 − t)³, 3(1 − t)²t, 3(1 − t)t² and t³, which is what the six lerps
// multiply out to. It is here so that a test can check the recipe against
// the formula.
func CubicClosed(p0, p1, p2, p3 Vec2, t float64) Vec2 {
	u := 1 - t
	return p0.Scale(u * u * u).Add(p1.Scale(3 * u * u * t)).Add(p2.Scale(3 * u * t * t)).Add(p3.Scale(t * t * t))
}

// A Curve is any function from a t in [0, 1] to a point.
type Curve func(t float64) Vec2

// Polyline samples a curve at n + 1 evenly spaced values of t: the n
// straight pieces between them are how a curve is drawn.
func Polyline(c Curve, n int) []Vec2 {
	pts := make([]Vec2, n+1)
	for i := range pts {
		pts[i] = c(float64(i) / float64(n))
	}
	return pts
}

// Lengths is the running length along a polyline: Lengths[i] is the
// distance along the pieces from the first point to the i-th. The last
// entry is the whole length, and the table is what turns a distance back
// into a t.
func Lengths(pts []Vec2) []float64 {
	out := make([]float64, len(pts))
	for i := 1; i < len(pts); i++ {
		out[i] = out[i-1] + pts[i].Sub(pts[i-1]).Len()
	}
	return out
}

// TAtLength reads the table backwards: the t at which the polyline has
// covered the distance s, by finding the piece s falls in and lerping
// within it. A distance past the end gives 1.
func TAtLength(table []float64, s float64) float64 {
	n := len(table) - 1
	if n <= 0 || s <= 0 {
		return 0
	}
	if s >= table[n] {
		return 1
	}
	i := 1
	for table[i] < s {
		i++
	}
	within := (s - table[i-1]) / (table[i] - table[i-1])
	return (float64(i-1) + within) / float64(n)
}
go vet ./...
Cubic is the six lerps written as three, two and one. Quadratic
is three lerps written as two and one. CubicClosed keeps the expanded
formula beside the recipe so tests can compare the two.
Curve is a function type from t to a point.
Polyline can draw any curve with that type, and Lengths
can measure it. TAtLength reads the length table backward to find the
t for a distance.
Drawing curve strips
Extend cmd/motion with the curves lab. The lab draws each curve as a
strip of straight pieces and marks the control points with small squares. Ebitengine
draws the pieces as ordinary lines.
The line and quadratic dots use the clock's t. The cubic dot uses
distance. At startup, the lab builds a length table for the cubic and prints the
measured length.
// cmd/motion/curves.go — create
package main

import (
	"flag"
	"fmt"
	"image/color"

	"github.com/hajimehoshi/ebiten/v2"
	"github.com/hajimehoshi/ebiten/v2/vector"

	"gez/internal/vec"
)

// The curves lab draws strips, a straight line, a quadratic and a cubic,
// each as a polyline of -segments pieces with its control points marked,
// and runs a dot along each on the ease lab's clock. The cubic's dot runs
// by distance along the curve, from a table of lengths, and the lab
// prints how far along the curve t = 0.5 is.
const (
	stripH   = 37.0 // rows a strip takes
	stripTop = 16.0 // the first strip's row
)

// The strips' control points, in the picture's coordinates. The cubic is
// the page's cubic, (0, 0), (0, 32), (160, 32), (240, 0), moved to its
// strip.
var (
	lineA, lineB = vec.Vec2{X: 40, Y: 48}, vec.Vec2{X: 280, Y: 24}
	quad         = [3]vec.Vec2{{X: 40, Y: 58}, {X: 160, Y: 86}, {X: 280, Y: 58}}
	cubic        = [4]vec.Vec2{{X: 40, Y: 94}, {X: 40, Y: 126}, {X: 200, Y: 126}, {X: 280, Y: 94}}
	curveColor   = color.RGBA{R: 120, G: 200, B: 120, A: 255}
)

type curvesLab struct {
	clock  int
	paused bool
	table  []float64 // the cubic's running length, one entry a piece
}

// newCurvesLab works the page's cubic at t = 0.5 by the recipe and prints
// it beside the closed form, then measures the cubic's length with the
// lab's pieces and with a thousand and twenty-four, and prints how much
// of it lies before t = 0.5.
func newCurvesLab() *curvesLab {
	p := cubic
	for i := range p {
		p[i] = p[i].Sub(cubic[0])
	}
	a, b, c := p[0].Lerp(p[1], 0.5), p[1].Lerp(p[2], 0.5), p[2].Lerp(p[3], 0.5)
	d, e := a.Lerp(b, 0.5), b.Lerp(c, 0.5)
	fmt.Printf("cubic %v %v %v %v at t = 0.5\n", p[0], p[1], p[2], p[3])
	fmt.Printf("  three lerps: %v %v %v\n", a, b, c)
	fmt.Printf("  two more:    %v %v\n", d, e)
	fmt.Printf("  one more:    %v; the closed form gives %v\n", d.Lerp(e, 0.5), vec.CubicClosed(p[0], p[1], p[2], p[3], 0.5))
	l := &curvesLab{}
	l.table = vec.Lengths(vec.Polyline(l.cubicAt, *segments))
	for _, n := range []int{*segments, 1024} {
		table := vec.Lengths(vec.Polyline(l.cubicAt, n))
		total, half := table[n], table[n/2]
		fmt.Printf("  %4d pieces: length %.4f; covered by t = 0.5: %.4f, %.4f of the total; half the length is at t = %.4f\n",
			n, total, half, half/total, vec.TAtLength(table, total/2))
	}
	return l
}

// The curves as functions of t.
func (l *curvesLab) lineAt(t float64) vec.Vec2 { return lineA.Lerp(lineB, t) }
func (l *curvesLab) quadAt(t float64) vec.Vec2 { return vec.Quadratic(quad[0], quad[1], quad[2], t) }
func (l *curvesLab) cubicAt(t float64) vec.Vec2 {
	return vec.Cubic(cubic[0], cubic[1], cubic[2], cubic[3], t)
}

// t is the clock as a fraction, as the ease lab has it.
func (l *curvesLab) t() float64 {
	return float64(l.clock) / easePeriod
}

// cubicT is the parameter the cubic's dot uses: the t at which the curve
// has covered the clock's fraction of its length, read off the table.
func (l *curvesLab) cubicT() float64 {
	return vec.TAtLength(l.table, l.t()*l.table[len(l.table)-1])
}

// covered is how much of the cubic's length lies before the parameter
// value s, as a fraction of the whole, read off the table.
func (l *curvesLab) covered(s float64) float64 {
	n := len(l.table) - 1
	i := int(s * float64(n))
	if i >= n {
		return 1
	}
	within := s*float64(n) - float64(i)
	return vec.Lerp(l.table[i], l.table[i+1], within) / l.table[n]
}

// step runs the clock as the ease lab does: Space pauses and prints,
// Left and Right move a paused clock and print, R starts over.
func (l *curvesLab) step(k keys) {
	if k.r {
		l.clock, l.paused = 0, false
		return
	}
	if k.space {
		l.paused = !l.paused
		if l.paused {
			l.print()
		}
		return
	}
	if !l.paused {
		l.clock = (l.clock + 1) % (easePeriod + 1)
		return
	}
	if k.right && l.clock < easePeriod {
		l.clock++
		l.print()
	}
	if k.left && l.clock > 0 {
		l.clock--
		l.print()
	}
}

// print writes the clock and where each strip's dot is.
func (l *curvesLab) print() {
	t, ct := l.t(), l.cubicT()
	fmt.Printf("tick %d t %.4f: line %v  quad %v\n", l.clock, t, l.lineAt(t), l.quadAt(t))
	fmt.Printf("  cubic at t %.4f: %v, %.4f of its length covered\n", ct, l.cubicAt(ct), l.covered(ct))
}

func (l *curvesLab) draw(screen *ebiten.Image, h *hud) {
	polyline := func(c vec.Curve) {
		pts := vec.Polyline(c, *segments)
		for i := 1; i < len(pts); i++ {
			vector.StrokeLine(screen, float32(pts[i-1].X), float32(pts[i-1].Y), float32(pts[i].X), float32(pts[i].Y), 1, curveColor, false)
		}
	}
	mark := func(p vec.Vec2) {
		vector.StrokeRect(screen, float32(p.X-2), float32(p.Y-2), 4, 4, 1, dimColor, false)
	}
	for i, name := range []string{"line", "quadratic", "cubic"} {
		h.text(screen, name, 4, stripTop+float64(i)*stripH)
	}
	polyline(l.lineAt)
	polyline(l.quadAt)
	polyline(l.cubicAt)
	for _, p := range []vec.Vec2{lineA, lineB, quad[0], quad[1], quad[2], cubic[0], cubic[1], cubic[2], cubic[3]} {
		mark(p)
	}
	t := l.t()
	for _, p := range []vec.Vec2{l.lineAt(t), l.quadAt(t), l.cubicAt(l.cubicT())} {
		vector.FillCircle(screen, float32(p.X), float32(p.Y), 3, yColor, false)
	}
}

func (l *curvesLab) lines() (top, bottom string) {
	state := "running"
	if l.paused {
		state = "paused"
	}
	return fmt.Sprintf("t %.4f  tick %d of %d  %s", l.t(), l.clock, easePeriod, state),
		fmt.Sprintf("cubic t %.4f  covered %.4f of %.4f px  %d pieces", l.cubicT(), l.covered(l.cubicT()), l.table[len(l.table)-1], *segments)
}

var segments = flag.Int("segments", 32, "the straight pieces a curve is drawn with")
// cmd/motion/main.go — extend
// newLab builds the lab named, from the seed: the one place a name
// becomes a lab. Labs that draw no random numbers ignore the seed.
func newLab(name string, seed uint64) (lab, error) {
switch name {
case "circle":
return newCircleLab(), nil
case "arrows":
return newArrowsLab(), nil
case "ship":
return newShipLab(), nil
case "ball":
return newBallLab(), nil
case "ease":
return newEaseLab(), nil
case "dots":
return newDotsLab(seed), nil
case "shapes":
return newShapesLab(), nil
case "grid":
return newGridLab(), nil
case "curves":
return newCurvesLab(), nil
}
return nil, fmt.Errorf("no lab called %q", name)
}go vet ./...
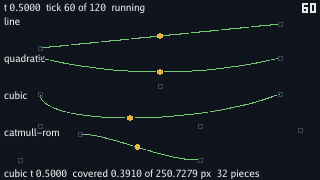
go run ./cmd/motion -lab curvesThe lab prints the interlude as it opens, and Space on tick 61, when the top line reads tick 60, prints the dots at t = 0.5:
$ go run ./cmd/motion -lab curves
cubic (0.0000, 0.0000) (0.0000, 32.0000) (160.0000, 32.0000) (240.0000, 0.0000) at t = 0.5
  three lerps: (0.0000, 16.0000) (80.0000, 32.0000) (200.0000, 16.0000)
  two more:    (40.0000, 24.0000) (140.0000, 24.0000)
  one more:    (90.0000, 24.0000); the closed form gives (90.0000, 24.0000)
    32 pieces: length 250.7279; covered by t = 0.5: 98.0398, 0.3910 of the total; half the length is at t = 0.5884
  1024 pieces: length 250.7743; covered by t = 0.5: 98.0824, 0.3911 of the total; half the length is at t = 0.5884
tick 60 t 0.5000: line (160.0000, 36.0000)  quad (160.0000, 72.0000)
  cubic at t 0.5884: (157.3019, 117.2493), 0.5000 of its length covered
The startup lines print the interlude. The recipe and closed form both give
(90, 24). The length table says that t = 0.5 covers 0.3910 of the
cubic's length, and half the length is at t = 0.5884.
At tick 60, the line's dot is at its middle and the quadratic's dot is at the
bottom of its dip. The cubic's dot uses t = 0.5884, so it is halfway
along the curve's length rather than halfway through the curve's parameter.
The clock is still an integer. cubicAt, quadAt and
lineAt are methods so they can be passed as Curve
functions. covered reads the table forward for the display.
cubicT reads it backward for the dot.
Make the cubic's dot use the clock's t directly, by replacing the one line of
cubicT with return l.t(), and press Space on tick 61 as
before:
$ go run ./cmd/motion -lab curves
tick 60 t 0.5000: line (160.0000, 36.0000)  quad (160.0000, 72.0000)
  cubic at t 0.5000: (130.0000, 118.0000), 0.3910 of its length covered
The dot is at (130, 118), which is the interlude's point moved into the strip.
It is exactly where the cubic puts t = 0.5, but only 39 per cent of
the curve's length is behind it.
Watch it run and the speed changes. The dot crawls through the tight bend, where a
step in t covers little distance. It moves faster through the long
sweep, where the same t step covers more distance.
Put cubicT back. It asks the length table for the t where
the clock's fraction of the length has been covered.
Adding Catmull-Rom
Add a Catmull-Rom curve. Unlike a Bézier curve, it passes through its two middle control points. The outer points set the direction as it arrives and leaves.
// internal/vec/curve.go — extend
// CatmullRom is the curve that passes through p1 at t = 0 and p2 at t = 1,
// with p0 and p3 setting the directions it arrives and leaves by: a cubic
// whose tangent at each end is half the vector between the neighbours on
// either side.
func CatmullRom(p0, p1, p2, p3 Vec2, t float64) Vec2 {
	t2, t3 := t*t, t*t*t
	return p1.Scale(2).
		Add(p2.Sub(p0).Scale(t)).
		Add(p0.Scale(2).Sub(p1.Scale(5)).Add(p2.Scale(4)).Sub(p3).Scale(t2)).
		Add(p1.Scale(3).Sub(p0).Sub(p2.Scale(3)).Add(p3).Scale(t3)).
		Scale(0.5)
}
// cmd/motion/curves.go — extend
// The curves lab draws four strips, a straight line, a quadratic, a cubic
// and a Catmull–Rom, each as a polyline of -segments pieces with its
// control points marked, and runs a dot along each on the ease lab's
// clock. The cubic's dot runs by distance along the curve, from a table
// of lengths, and the lab prints how far along the curve t = 0.5 is.
const (
stripH = 37.0 // rows a strip takes
stripTop = 16.0 // the first strip's row
)
// The strips' control points, in the picture's coordinates. The cubic is
// the page's cubic, (0, 0), (0, 32), (160, 32), (240, 0), moved to its
// strip.
var (
lineA, lineB = vec.Vec2{X: 40, Y: 48}, vec.Vec2{X: 280, Y: 24}
quad = [3]vec.Vec2{{X: 40, Y: 58}, {X: 160, Y: 86}, {X: 280, Y: 58}}
cubic = [4]vec.Vec2{{X: 40, Y: 94}, {X: 40, Y: 126}, {X: 200, Y: 126}, {X: 280, Y: 94}}
catmull = [4]vec.Vec2{{X: 20, Y: 160}, {X: 80, Y: 134}, {X: 200, Y: 160}, {X: 300, Y: 130}}
curveColor = color.RGBA{R: 120, G: 200, B: 120, A: 255}
)
func (l *curvesLab) catmullAt(t float64) vec.Vec2 {
return vec.CatmullRom(catmull[0], catmull[1], catmull[2], catmull[3], t)
}
// print writes the clock and where each strip's dot is.
func (l *curvesLab) print() {
t, ct := l.t(), l.cubicT()
fmt.Printf("tick %d t %.4f: line %v quad %v\n", l.clock, t, l.lineAt(t), l.quadAt(t))
fmt.Printf(" cubic at t %.4f: %v, %.4f of its length covered\n", ct, l.cubicAt(ct), l.covered(ct))
fmt.Printf(" catmull-rom %v\n", l.catmullAt(t))
}
func (l *curvesLab) draw(screen *ebiten.Image, h *hud) {
polyline := func(c vec.Curve) {
pts := vec.Polyline(c, *segments)
for i := 1; i < len(pts); i++ {
vector.StrokeLine(screen, float32(pts[i-1].X), float32(pts[i-1].Y), float32(pts[i].X), float32(pts[i].Y), 1, curveColor, false)
}
}
mark := func(p vec.Vec2) {
vector.StrokeRect(screen, float32(p.X-2), float32(p.Y-2), 4, 4, 1, dimColor, false)
}
for i, name := range []string{"line", "quadratic", "cubic", "catmull-rom"} {
h.text(screen, name, 4, stripTop+float64(i)*stripH)
}
polyline(l.lineAt)
polyline(l.quadAt)
polyline(l.cubicAt)
polyline(l.catmullAt)
for _, p := range []vec.Vec2{lineA, lineB, quad[0], quad[1], quad[2], cubic[0], cubic[1], cubic[2], cubic[3], catmull[0], catmull[1], catmull[2], catmull[3]} {
mark(p)
}
t := l.t()
for _, p := range []vec.Vec2{l.lineAt(t), l.quadAt(t), l.cubicAt(l.cubicT()), l.catmullAt(t)} {
vector.FillCircle(screen, float32(p.X), float32(p.Y), 3, yColor, false)
}
}go vet ./...
go run ./cmd/motion -lab curves
go run ./cmd/motion -lab curves -segments 4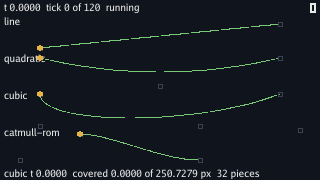
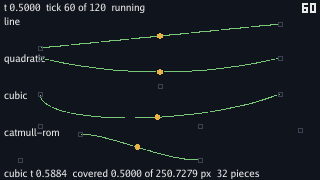
$ go run ./cmd/motion -lab curves
tick 60 t 0.5000: line (160.0000, 36.0000)  quad (160.0000, 72.0000)
  cubic at t 0.5884: (157.3019, 117.2493), 0.5000 of its length covered
  catmull-rom (137.5000, 147.2500)
The Catmull-Rom dot is at (137.5, 147.25) when t = 0.5. At
t = 0, the curve is on its second control point. At t = 1,
it is on its third control point.
CatmullRom is written as a formula because the control points have to
be reweighted before the cubic is evaluated. The result is still a cubic curve.
$ go run ./cmd/motion -lab curves -segments 4
cubic (0.0000, 0.0000) (0.0000, 32.0000) (160.0000, 32.0000) (240.0000, 0.0000) at t = 0.5
  three lerps: (0.0000, 16.0000) (80.0000, 32.0000) (200.0000, 16.0000)
  two more:    (40.0000, 24.0000) (140.0000, 24.0000)
  one more:    (90.0000, 24.0000); the closed form gives (90.0000, 24.0000)
     4 pieces: length 248.3271; covered by t = 0.5: 95.8604, 0.3860 of the total; half the length is at t = 0.5896
  1024 pieces: length 250.7743; covered by t = 0.5: 98.0824, 0.3911 of the total; half the length is at t = 0.5884
With four pieces, each curve looks like four straight lines. The cubic length is 248.3271, about one per cent short of the 1024-piece measurement. A chord is shorter than the arc it cuts.
With thirty-two pieces, the cubic length is within a twentieth of one per cent of the 1024-piece measurement. That is the count the lab uses.
Measuring curves
Curves are built from lerps. A cubic uses six lerps at a given t, and
moving a control point changes the curve through the weights in the formula. The same
idea works for colours, positions and any other values that can be lerped.
A screen draws straight pieces, not true curves, so a polyline is the displayed form
of the curve. It is also how the lab measures length. Reading the length table
backward turns a distance along the path into a t.
To move at a set speed in pixels per second, keep a distance instead of a
t. Each tick adds speed times Dt to the distance, then the
table finds the point.
Checkpoint
- Work a cubic at t = 0.5 by six lerps, by hand, to (90, 24), and check it against the four weights 1/8, 3/8, 3/8, 1/8.
- Say which points a Bézier passes through and which it only approaches, and which a Catmull–Rom passes through.
- Draw any curve as a polyline of n pieces, and say what n costs and what it buys, from 248.33 against 250.77.
- Measure a curve's length with a table, read 0.3910 off it at t = 0.5, and say why t is not distance.
- Move a dot evenly along a curve by reading the table backward, and say what a dot moved by t does in a bend.
- Move a thing at a set speed in pixels a second along a curve, keeping a distance and not a t.
Exercise 1 — a fifth control point. Extend the Catmull–Rom strip to five points and draw it as two pieces that join at the middle point. Is the join smooth?
With points P0…P4, the first piece is
CatmullRom(P0, P1, P2, P3, t) and the second is
CatmullRom(P1, P2, P3, P4, t): each piece's four points slide one
along. The join at P2 is smooth because both pieces leave and arrive
along the same tangent, half of P3 − P1, which is
the whole reason the tangent was defined from the neighbours. Draw the two
pieces in two colours and the seam is invisible in the curve and visible only
in the colour.
Exercise 2 — a set speed. Make the cubic's dot move at forty pixels a second along the curve, whatever the clock does, and read how long the whole curve takes.
Keep a dist float64 on the lab, add 40 * vec.Dt to it
every unpaused tick, and draw the dot at
l.cubicAt(vec.TAtLength(l.table, l.dist)). The curve is 250.73
pixels long, so the dot takes 6.27 seconds, 376 ticks, to reach the end and
TAtLength pins it there; the dot's speed on the screen is the same
through the bend and the sweep, which a ruler on the screen and a stopwatch
confirm.
Exercise 3 — the control points by hand. Drag the cubic's second control point with the mouse and watch the printed length and the t of half the length change.
Read the cursor as chapter 3 did, and while the mouse button is held set
cubic[1] to it and rebuild l.table. Pull the point far
to the left and the tight bend at the start gets tighter: the length grows,
the fraction covered by t = 0.5 falls below 0.39, and the t of half the length
climbs. Push it toward the third point and the curve straightens, the fraction
climbs toward 0.5 and the two halves of t come out nearly equal, which is the
one case where t is close to distance: a nearly straight curve.